
Category:Renewable energy charts in unspecified languages

Media in category "Renewable energy charts in unspecified languages"
The following 200 files are in this category, out of 638 total.
(previous page) (next page)-
 07-01-13-Tempkurfe.jpg 1,296 × 652; 239 KB
-
 10 pays monde consommateurs électricité.svg 938 × 563; 106 KB
-
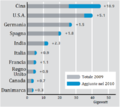
 10 pays UE-27 consommateurs électricité.svg 938 × 563; 111 KB
-
 2005-2016 Renewable Electric Energy Profile.jpg 476 × 296; 37 KB
-
 2011staterenewableelectricalgeneration.png 481 × 661; 8 KB
-
.png/120px-2014_Contributions_by_Renewables_to_US_Total_Energy_(11-).png) 2014 Contributions by Renewables to US Total Energy (11-).png 384 × 350; 15 KB
2014 Contributions by Renewables to US Total Energy (11-).png 384 × 350; 15 KB
-

-
 2018 State Geothermal Electric Generation.jpg 483 × 292; 20 KB
-
 2018 State Hydro Electric Generation.jpg 483 × 409; 33 KB
-
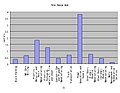
 2018 State Renewable Electric Generation.jpg 483 × 775; 59 KB
-
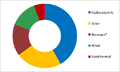
 2019년 저탄소원에서 생산되는 전력의 비율.png 1,280 × 960; 215 KB
-
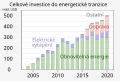 20210119 Renewable energy investment - 2004- BloombergNEF cs.svg 512 × 346; 11 KB
-
 20210119 Renewable energy investment - 2004- BloombergNEF-cs.svg 850 × 575; 39 KB
-
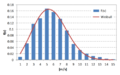
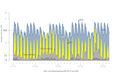 20230710 einspeiseprofil fluktuierend jun.png 1,000 × 600; 27 KB
-

-
 AEO 2013 Projection for US Wind and Solar.png 1,024 × 768; 40 KB
-
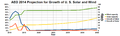 AEO 2014 Growth Projection for US Wind and Solar.png 1,200 × 360; 27 KB
-
 AEO 2015 Growth Projection for US Wind and Solar.png 1,200 × 360; 27 KB
-
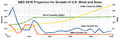 AEO 2016 Growth Projection for US Wind and Solar.png 1,200 × 400; 33 KB
-
 AEO wind and solar capacity projections.png 1,024 × 768; 33 KB
-
 Alabama Solar Power.webp 3,748 × 1,915; 70 KB
-
 Albania electricity production.svg 639 × 484; 28 KB
-
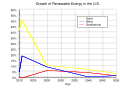 Annual Growth of Renewable Energy in the US.svg 750 × 560; 10 KB
-
 Australia renewable electricity production.svg 639 × 545; 203 KB
-
 Average monthly Insolation to 15 deg N S.jpg 1,226 × 788; 151 KB
-
 AZ Solar Profile 2014.png 481 × 342; 10 KB
-
 Barstow solar array output.png 825 × 375; 31 KB
-
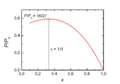 Betzsche Leistungskurve.png 900 × 631; 5 KB
-
 BioEnergy.JPG 577 × 447; 34 KB
-
 BioEthanolFootprint.jpg 959 × 587; 153 KB
-
 BioethanolsCountryOfOrigin.jpg 1,357 × 949; 161 KB
-
 Biofuels in eu 2007.png 649 × 419; 14 KB
-
 Biomasse cultivée 2018 UE 28 CCR EN.jpg 1,401 × 436; 147 KB
-
 Biomasse cultivée 2018 UE 28 CCR FR.jpg 1,422 × 434; 143 KB
-
 Bird mortality blocks.svg 512 × 683; 17 KB
-
 BMU EEinZahlen Jun2010 p48 WindenergieleistungEU 1990-2009.png 1,025 × 533; 21 KB
-
 Boston MA DaylightChart.png 969 × 685; 46 KB
-
 Boxplot Europe heat flow vs Moho depth.png 2,705 × 1,943; 141 KB
-
 Capacidad eolica.png 1,792 × 1,315; 253 KB
-
 Capacite eolienne 2000-2008.svg 713 × 603; 88 KB
-
 Causes of bird deaths.png 1,876 × 995; 149 KB
-
.pdf/page1-120px-CellPVeff(rev190410).pdf.jpg) CellPVeff(rev190410).pdf 2,283 × 1,227; 559 KB
CellPVeff(rev190410).pdf 2,283 × 1,227; 559 KB
-
 Charges service public EnR métropole.jpg 529 × 340; 22 KB
-
 Charges service public électricité 2003-2013.jpg 518 × 340; 27 KB
-
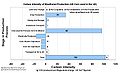
 CO2 Emissions from Electricity Production IPCC.png 1,244 × 773; 42 KB
-
 Colorado solar power.webp 3,673 × 1,669; 67 KB
-

-
 Complémentarité éolien solaire.png 1,081 × 631; 13 KB
-
 Cost of electricity by source.png 2,294 × 1,074; 166 KB
-
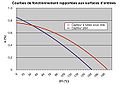 CourbesR CSTh SE.jpg 1,234 × 873; 121 KB
-
 CourbesR CSTh SHT.jpg 1,193 × 905; 121 KB
-
_2018_UE_28_CCR.jpg/120px-Crops_by_crop_group_(bottom_pane)_2018_UE_28_CCR.jpg) Crops by crop group (bottom pane) 2018 UE 28 CCR.jpg 1,427 × 632; 291 KB
Crops by crop group (bottom pane) 2018 UE 28 CCR.jpg 1,427 × 632; 291 KB
-
 CSPE unitaire 2002-2013.jpg 537 × 340; 29 KB
-
 Cumulative CPV Installations in MW by country by November 2014 plain.svg 1,347 × 749; 390 KB
-
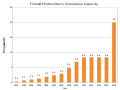
 Czech Republic Photovoltaics Installed Capacity.svg 800 × 600; 7 KB
-
 Danish wind power LCOE vs wind speed in 2012.png 844 × 506; 58 KB
-
 Denmark wind power generation by year.png 717 × 300; 10 KB
-
 DOE 2016. Cost Reductions Since 2008.jpg 1,965 × 623; 208 KB
-
 Dunkelflaute Duitsland januari 2017.png 1,512 × 555; 42 KB
-
 EnergiEolica 01 01.png 500 × 446; 71 KB
-
 EnergiEolica 01 03.png 500 × 625; 66 KB
-
 EnergiEolica 01 04.png 500 × 313; 39 KB
-
 EnergiEolica 01 13.png 500 × 250; 44 KB
-
 EnergiEolica 01 15.png 500 × 286; 46 KB
-
 Energy production in the Netherlands by source.svg 547 × 338; 87 KB
-
 Energy Transition Timeline.pdf 2,750 × 1,629; 786 KB
-
 Eolico2008.jpg 978 × 643; 80 KB
-
 Estimated Distributed Solar by States with less than 600 M kWh.png 481 × 726; 15 KB
-
_2009_v._2019.png/120px-Estimated_Renewable_Share_of_Total_Final_Energy_Consumption_(TFEC)_2009_v._2019.png) Estimated Renewable Share of Total Final Energy Consumption (TFEC) 2009 v. 2019.png 1,181 × 1,181; 186 KB
Estimated Renewable Share of Total Final Energy Consumption (TFEC) 2009 v. 2019.png 1,181 × 1,181; 186 KB
-
.png/120px-EU_Average_and_Greece_Wind_Energy_Capacity_(MW).png) EU Average and Greece Wind Energy Capacity (MW).png 1,098 × 650; 52 KB
EU Average and Greece Wind Energy Capacity (MW).png 1,098 × 650; 52 KB
-
 EU27 geothermal.jpg 852 × 528; 44 KB
-
 Europe top 10 wind power capacity per capita.svg 4,751 × 2,985; 21 KB
-
 Evol tarifs achat élec PV France.jpg 442 × 314; 31 KB
-
 Expected structure of renewable energy production in 2020.png 621 × 417; 14 KB
-
 Finland Photovoltaics Installed Capacity.svg 800 × 600; 8 KB
-
 First Solar learning curve 2006-2010.png 640 × 480; 17 KB
-

-
 Foisonnement éolien Europe.png 1,080 × 576; 14 KB
-
 Frekvensfördelning.jpg 970 × 604; 59 KB
-
 Generation duration curve.png 1,076 × 551; 101 KB
-
 Geothermal capacity.svg 1,000 × 600; 9 KB
-
 Geothermal-energy-production-pl.svg 800 × 500; 45 KB
-
 German nuclear phase-out chart, 2002–2017.png 1,024 × 717; 390 KB
-
 German Wind and Solar 2012-01.png 6,150 × 480; 93 KB
-
 German Wind and Solar 2012-02.png 6,200 × 480; 112 KB
-
 German Wind and Solar 2012-03.png 6,201 × 480; 93 KB
-
 German Wind and Solar 2012-04.png 6,250 × 480; 110 KB
-
 German Wind and Solar 2012-05.png 6,200 × 480; 88 KB
-
 German Wind and Solar 2012-06.png 6,200 × 480; 198 KB
-
 German Wind and Solar 2012-07.png 6,180 × 480; 87 KB
-
 German Wind and Solar 2012-08.png 6,200 × 480; 92 KB
-
 German Wind and Solar 2012-09.png 6,200 × 480; 88 KB
-
 German Wind and Solar 2012-10.png 6,200 × 480; 93 KB
-
 German Wind and Solar 2012-11.png 6,200 × 480; 89 KB
-
 German Wind and Solar 2012-12.png 6,200 × 480; 237 KB
-
 German Wind and Solar 2014-07-01 to 2014-07-07.svg 600 × 400; 139 KB
-
 German Wind and Solar Generation Histogram-Equal Annual.svg 800 × 600; 7 KB
-
 German Wind and Solar Generation Histogram-Equal Max Daily.svg 800 × 600; 7 KB
-
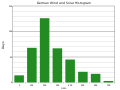 German Wind and Solar Generation Histogram.svg 800 × 600; 7 KB
-
 German Wind and Solar June 2012.png 5,785 × 400; 114 KB
-
 German Wind and Solar semilog.png 990 × 360; 33 KB
-
 German wind and solar-semilog.svg 800 × 600; 30 KB
-
 Germany 2020-05-28 Live CO₂ emissions of electricity consumption.png 516 × 724; 36 KB
-
 Germany Electricity Generation 5-04-05-2013.png 1,024 × 768; 77 KB
-
 Germany Electricity Generation 5-25-26-2012.png 773 × 354; 22 KB
-
 Germany Electricity Generation 5-26-12.png 817 × 330; 19 KB
-

-

-
-

-

-

-
 Germany Electricity Generation from Wind and Solar in 2011.png 800 × 600; 24 KB
-
 Germany Electricity Generation from Wind and Solar in 2012.png 1,024 × 768; 26 KB
-
 Germany Electricity Generation from Wind and Solar in 2013.png 1,024 × 768; 33 KB
-
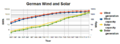
 Germany Electricity Generation from Wind and Solar in 2014.svg 750 × 560; 21 KB
-
 Germany Electricity Generation from Wind and Solar in 2015.svg 750 × 560; 21 KB
-
 Germany Electricity Generation from Wind and Solar in 2016.svg 750 × 560; 21 KB
-
 Germany Electricity Generation-2013-06-16.png 1,024 × 768; 68 KB
-
 Germany Electricity Generation-2013-06-18.png 1,024 × 768; 66 KB
-
 Germany Monthly Electricity Generation from Wind and Solar.png 1,800 × 600; 55 KB
-
 Germany renewable electricity generation percentage-2011.png 640 × 480; 17 KB
-
 Germany Renewable Energy 2016-05-07 to 09.svg 750 × 560; 20 KB
-
 Germany Wind And Solar 2016-05-07 to 09.svg 750 × 560; 17 KB
-
 Germany Wind and Solar Generation Percentage-semilog.svg 800 × 600; 25 KB
-
.png/120px-Germany%27s_renewable_electricity_generation_from_2000_through_2017_(47958199548).png)
-
 Germany-PV-SystemPrice.png 552 × 498; 19 KB
-
 GET en 2A11 price of solar down in Germany since 2006.png 1,001 × 769; 58 KB
-
_life_cycle_emissions_for_Miscanthus_x_giganteus_and_SRC_Poplar.jpg/120px-GHG_(CO2_and_N2O)_life_cycle_emissions_for_Miscanthus_x_giganteus_and_SRC_Poplar.jpg) GHG (CO2 and N2O) life cycle emissions for Miscanthus x giganteus and SRC Poplar.jpg 2,128 × 1,024; 242 KB
GHG (CO2 and N2O) life cycle emissions for Miscanthus x giganteus and SRC Poplar.jpg 2,128 × 1,024; 242 KB
-
 Global Energy Consumption tl.svg 960 × 791; 78 KB
-
 Global Energy Potential 2014 08 09.svg 851 × 647; 70 KB
-
 Global energy potential and consumption.svg 840 × 636; 85 KB
-
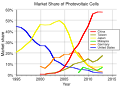
 Global Market Share by PV Technology from 1990 to 2013.svg 1,252 × 810; 30 KB
-
 Global photovoltaics market share by technology 1980-2021.svg 513 × 344; 53 KB
-
 Global renewable electricity generation by energy source.png 1,793 × 1,104; 115 KB
-
 Global-RE-Investment-VC-Eng.png 596 × 510; 17 KB
-
 Global-RE-Investment-VC-JP.png 592 × 516; 19 KB
-
 Globalni emise sklenikovych plynu a moznosti jejich snizeni CS.svg 980 × 1,020; 100 KB
-
 GlobalREPowerCapacity-exHydro-Eng.png 638 × 567; 11 KB
-
 GlobalREPowerCapacity-exHydro-JP.png 641 × 565; 12 KB
-
 GlobalWindPowerCumulativeCapacity GW.png 1,200 × 640; 52 KB
-
 GlobalWindPowerCumulativeCapacity-withForecast.png 640 × 480; 18 KB
-
 GlobalWindPowerCumulativeCapacity.png 1,200 × 640; 36 KB
-
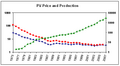 Graph of PV Price and Production.PNG 450 × 247; 7 KB
-
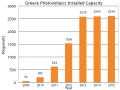 Greece Photovoltaics Installed Capacity.svg 800 × 600; 7 KB
-
 Growth of Wind and Solar to 92% by 2030.png 640 × 480; 23 KB
-
 GWEC-semilog.png 1,024 × 768; 16 KB
-
 GWEC2016.png 1,075 × 601; 30 KB
-
 Haalbaarheid eu doelstellingen.gif 576 × 294; 7 KB
-
 Hawaii solar power.webp 4,099 × 1,918; 64 KB
-
 Historical trend alcohol production by ethanol type Brazil 1990 2008.png 886 × 717; 107 KB
-
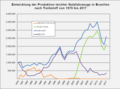 Historical trend ethanol and flex veh in Brazil 1979 2008 de.png 821 × 606; 76 KB
-
 Historical trend ethanol and flex veh in Brazil 1979 2008.png 821 × 606; 73 KB
-
 Historical trend ethanol production by region Brazil 1990 2008.png 1,181 × 821; 170 KB
-
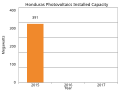 Honduras Photovoltaics Installed Capacity.svg 800 × 600; 6 KB
-
 Horas solares pico.png 711 × 380; 5 KB
-
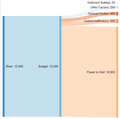 Hydroelectric Sankey Diagram.png 598 × 595; 14 KB
-
 Idaho solar power.webp 3,926 × 1,976; 64 KB
-
 Illinois solar power.webp 3,775 × 2,084; 56 KB
-

-
 India Cumulative Solar Capacity 2014-25.png 910 × 513; 14 KB
-
 India Photovoltaics Installed Capacity.svg 800 × 600; 7 KB
-
 India renewable electricity production.svg 639 × 545; 197 KB
-
 India Solar Capacity Additions 2015-25.png 891 × 500; 14 KB
-
 Indiana solar power.webp 3,968 × 2,024; 58 KB
-
_1995-2002.svg/120px-Installed_Wind_energy_(World%2C_EU%2C_Germany)_1995-2002.svg.png) Installed Wind energy (World, EU, Germany) 1995-2002.svg 480 × 351; 65 KB
Installed Wind energy (World, EU, Germany) 1995-2002.svg 480 × 351; 65 KB
-
_2000-2008.svg/120px-Installed_Wind_energy_(World%2C_EU%2C_Germany)_2000-2008.svg.png) Installed Wind energy (World, EU, Germany) 2000-2008.svg 480 × 375; 6 KB
Installed Wind energy (World, EU, Germany) 2000-2008.svg 480 × 375; 6 KB
-
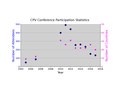 International CPV-x Conference - Historical Participation Statistics.pdf 1,650 × 1,275; 10 KB
-
 Iowa solar power.webp 3,688 × 1,682; 53 KB
-
 Israel Photovoltaics Installed Capacity.svg 800 × 600; 8 KB
-
 Italy 2015.png 481 × 289; 9 KB
-
 Italy Photovoltaics Installed Capacity.svg 800 × 600; 19 KB
-
 Italy renewable electricity production.svg 639 × 579; 191 KB
-
 Italy wind solar prodution 2007-2014.svg 514 × 354; 20 KB
-
 Jahresgang&TagesgangWindkarft.png 1,424 × 743; 341 KB
-
 Jamaica renewable electricity production.svg 639 × 455; 267 KB
-
 Japan Photovoltaics Installed Capacity.svg 800 × 600; 8 KB
-
 Japan Wind and Solar Generation Percentage-semilog.svg 800 × 600; 13 KB
-
 Japan Wind and Solar Generation.svg 750 × 560; 16 KB
-
 Japan-SolarCellProductionAndExport.png 624 × 532; 10 KB
-
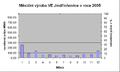 Jindrichovice2005.png 1,004 × 602; 26 KB
-
 Kansas solar power.webp 3,707 × 1,996; 50 KB
-
 Kentucky solar power.webp 3,910 × 1,942; 54 KB
-
 Korea Photovoltaics Installed Capacity.svg 800 × 600; 8 KB
-
 Largest Producers of Solar Cells by Country-Market Share.svg 750 × 560; 20 KB
-
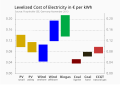 LCOE comparison fraunhofer november2013.svg 2,085 × 1,468; 31 KB
-
 Lee Ranch Wind Speed Frequency.png 504 × 288; 9 KB
-
 Lee Ranch Wind Speed Frequency.svg 600 × 340; 119 KB
-
.png/120px-Limiting_global_warming_to_2_degrees_Celsius_-_options_to_reduce_greenhouse_gas_emissions_(PBL).png)
-
EN.svg/120px-Limiting_global_warming_to_2_degrees_Celsius_-_options_to_reduce_greenhouse_gas_emissions_(PBL)EN.svg.png)
-
TR.svg/120px-Limiting_global_warming_to_2_degrees_Celsius_-_options_to_reduce_greenhouse_gas_emissions_(PBL)TR.svg.png)
-
 Lookout Windpower Energy Output.png 1,918 × 874; 111 KB
-
 Louisiana solar power.webp 3,889 × 1,511; 47 KB
-
 Maine solar power.webp 3,958 × 1,983; 56 KB
-
 Maine Wind Power Generation 2007 - 2017.png 600 × 400; 28 KB
-
 Major Solar Farms.jpg 480 × 289; 38 KB
-
 Major US Solar Farms.png 504 × 349; 16 KB
-
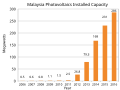 Malaysia Photovoltaics Installed Capacity.svg 800 × 600; 8 KB
-
 Mapa svijeta obojana prema potrošnji električne energije.jpg 1,800 × 820; 151 KB
-
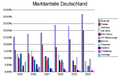 Marktanteile Windenergie Deutschland.PNG 1,097 × 705; 48 KB


.png)


_2018_UE_28_CCR.jpg)


_2009_v._2019.png)
.png)


.png)


_life_cycle_emissions_for_Miscanthus_x_giganteus_and_SRC_Poplar.jpg)


_1995-2002.svg)
_2000-2008.svg)


.png)
EN.svg)
TR.svg)


