
Category:Renewable energy charts with unspecified year of latest data
Media in category "Renewable energy charts with unspecified year of latest data"
The following 74 files are in this category, out of 74 total.
-
 2011- Renewable energy capacity - International Energy Agency-cs.svg 1,200 × 675; 4 KB
-
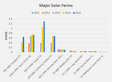 2015 Major Solar Farms.png 507 × 348; 16 KB
-
 2015 Top Five Wind States.png 481 × 288; 9 KB
-
 2015-2019 Capacity Projections.png 507 × 338; 11 KB
-

-
 20210119 Renewable energy investment - 2004- BloombergNEF cs.svg 512 × 346; 11 KB
-
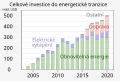
 20210119 Renewable energy investment - 2004- BloombergNEF-cs.svg 850 × 575; 39 KB
-
 Addedcapacityworld2009.jpg 1,450 × 884; 64 KB
-

-
 Belgium Photovoltaics Installed Capacity.svg 800 × 600; 7 KB
-

-
 Charges service public EnR métropole.jpg 529 × 340; 22 KB
-
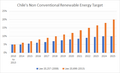 Chile's Non Conventional Renewable Energy Target.png 539 × 328; 8 KB
-
 Czech Republic Photovoltaics Installed Capacity.svg 800 × 600; 7 KB
-
 DOE 2016. Cost Reductions Since 2008.jpg 1,965 × 623; 208 KB
-
 Dunkelflaute Duitsland januari 2017.png 1,512 × 555; 42 KB
-
 Electricity percentage worldwide by source.png 800 × 600; 30 KB
-
 Energy production in the Netherlands by source.svg 547 × 338; 87 KB
-
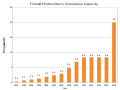 Finland Photovoltaics Installed Capacity.svg 800 × 600; 8 KB
-
 Frekvensfördelning.jpg 970 × 604; 59 KB
-
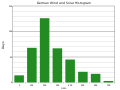 German Wind and Solar Generation Histogram.svg 800 × 600; 7 KB
-
 Global solar power is doubling every three years.png 2,000 × 1,608; 190 KB
-
 GlobalREPowerCapacity-exHydro-JP.png 641 × 565; 12 KB
-
 Growth of Wind and Solar to 92% by 2030.png 640 × 480; 23 KB
-
 GWEC2016.png 1,075 × 601; 30 KB
-
 Historical trend ethanol production by region Brazil 1990 2008.png 1,181 × 821; 170 KB
-
 India Photovoltaics Installed Capacity.svg 800 × 600; 7 KB
-
-
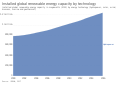
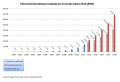
 Installed renewable energy capacity, OWID.svg 850 × 600; 5 KB
-
 Kapazität OffshoreWindkraftwerke 2010 bis 2022 Balken.png 3,216 × 2,461; 84 KB
-
 Korea Photovoltaics Installed Capacity.svg 800 × 600; 8 KB
-
 Maine Wind Power Generation 2007 - 2017.png 600 × 400; 28 KB
-
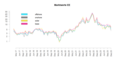 Marktwerte EE.png 1,875 × 937; 27 KB
-
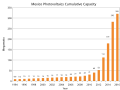 Mexico Photovoltaics Installed Capacity.svg 800 × 600; 11 KB
-
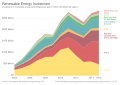
.png/120px-Modern-renewable-energy-consumption_(OWID_0655).png) Modern-renewable-energy-consumption (OWID 0655).png 850 × 600; 59 KB
Modern-renewable-energy-consumption (OWID 0655).png 850 × 600; 59 KB
-
.png/120px-Modern-renewable-prod_(OWID_0652).png) Modern-renewable-prod (OWID 0652).png 850 × 600; 57 KB
Modern-renewable-prod (OWID 0652).png 850 × 600; 57 KB
-
 ModulePrices-Japan-2011.png 572 × 486; 12 KB
-
 Netherlands Photovoltaics Installed Capacity.svg 800 × 600; 10 KB
-
 Number of patents filed for renewable energy technologies, OWID.svg 850 × 600; 26 KB
-
.png/120px-Patents-filed-for-renewables_(OWID_0672).png) Patents-filed-for-renewables (OWID 0672).png 850 × 600; 92 KB
Patents-filed-for-renewables (OWID 0672).png 850 × 600; 92 KB
-
 Polysilicon prices history since 2004.svg 745 × 919; 17 KB
-
 Price history of silicon PV cells since 1977 de.svg 729 × 649; 29 KB
-
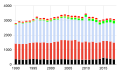
 Production énergies renouvelables France 1970-2011.jpg 567 × 340; 28 KB
-

-
 PV 2000 2016.svg 780 × 530; 62 KB
-
 PV-Produktion weltweit 2005 - 2020.svg 515 × 278; 296 KB
-
.jpg/120px-PVeff(rev121015b).jpg) PVeff(rev121015b).jpg 4,017 × 2,424; 3.64 MB
PVeff(rev121015b).jpg 4,017 × 2,424; 3.64 MB
-
.jpg/120px-PVeff(rev130212).jpg) PVeff(rev130212).jpg 4,031 × 2,662; 2.25 MB
PVeff(rev130212).jpg 4,031 × 2,662; 2.25 MB
-
a.jpg/120px-PVeff(rev131106)a.jpg) PVeff(rev131106)a.jpg 5,428 × 3,550; 4.61 MB
PVeff(rev131106)a.jpg 5,428 × 3,550; 4.61 MB
-
.jpg/120px-PVeff(rev150527).jpg) PVeff(rev150527).jpg 4,190 × 2,456; 3.41 MB
PVeff(rev150527).jpg 4,190 × 2,456; 3.41 MB
-
.jpg/120px-PVeff(rev150605).jpg) PVeff(rev150605).jpg 4,190 × 2,456; 3.42 MB
PVeff(rev150605).jpg 4,190 × 2,456; 3.42 MB
-
.jpg/120px-PVeff(rev160211).jpg) PVeff(rev160211).jpg 4,265 × 2,414; 3.46 MB
PVeff(rev160211).jpg 4,265 × 2,414; 3.46 MB
-
.jpg/120px-PVeff(rev161202).jpg) PVeff(rev161202).jpg 4,348 × 2,415; 3.52 MB
PVeff(rev161202).jpg 4,348 × 2,415; 3.52 MB
-
 Re investment 1995-2007.jpg 657 × 383; 87 KB
-
 Renewable Electric Energy 10yr Actual 5yr predicted.png 509 × 370; 14 KB
-
 Renewable energy generation, 1, OWID.svg 850 × 600; 16 KB
-
 Renewable Energy Investment, OWID.svg 850 × 600; 14 KB
-
.png/120px-Renewable-energy-gen_(OWID_0863).png) Renewable-energy-gen (OWID 0863).png 850 × 600; 58 KB
Renewable-energy-gen (OWID 0863).png 850 × 600; 58 KB
-
 Renewables-timeline.png 540 × 382; 14 KB
-
 Russia Hydro-electricity.png 604 × 377; 23 KB
-

-

-
 Solar PV system costs, OWID.svg 850 × 600; 7 KB
-
 SolarCellProduction-E.PNG 498 × 459; 9 KB
-
 Spain Photovoltaics Installed Capacity.svg 800 × 600; 10 KB
-
 Stromerzeugung Erneuerbar brutto Deutschalnd.png 809 × 388; 9 KB
-
 Taiwan Photovoltaics Installed Capacity.svg 800 × 600; 6 KB
-
.png/120px-Tendances_des_coûts_de_l%27énergie_(2010-2019).png) Tendances des coûts de l'énergie (2010-2019).png 2,879 × 2,268; 356 KB
Tendances des coûts de l'énergie (2010-2019).png 2,879 × 2,268; 356 KB
-
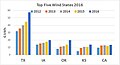 Top Five States for Wind Generation of Electric Energy 2016.jpg 533 × 289; 32 KB
-
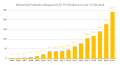
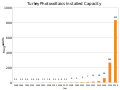 Turkey Photovoltaics Installed Capacity.svg 800 × 600; 11 KB
-
 US Economic Solar PV Capacity vs Installation Cost.png 640 × 480; 9 KB
-
 Wind 2006andprediction en.png 626 × 397; 258 KB
-
 Wind Farm Capacity Factors 2013-2017.jpg 484 × 303; 42 KB
-
 Windleistung D EU.png 1,584 × 1,224; 35 KB


.png)
.png)


.png)


.jpg)
.jpg)
a.jpg)
.jpg)
.jpg)
.jpg)
.jpg)


.png)


.png)


